Don't worry I've automated scraping your tagged Instagram posts for you!
If you do any work around Instagram, you know that the "Tagged" photos on your profile is a gold mine of insights! These are your brand advocates speaking about your products. Understanding the frequency and timing of their sharing, what they are saying about your brand, what hashtags they are using is SO useful to helping you craft your brand messaging and approach on Instagram. But aside from clicking through every single image, how can you digest all of that information? By scraping their JSON of course!Figure Out How Instagram Generates Your Tagged Feed
When on your Tagged page, instagram.com/[yourhandlehere]/tagged, right click in your browser to Inspect or open your dev tools. Select the "Network" tab, filter to the XHR. Once you start scrolling to populate new images from the initial 12 that loaded you should see a call with the name "?query_hash=..." Select that network call to get the full REQUEST URL.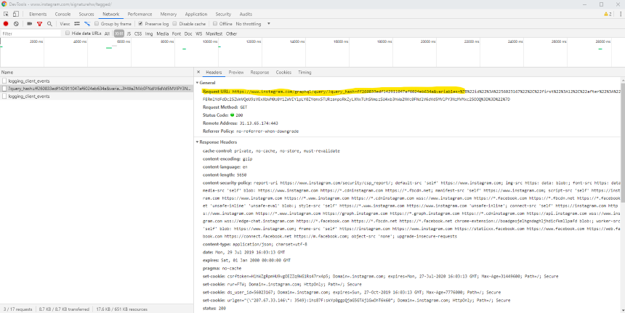
So What Is All This?
Go ahead and copy and paste that REQUEST URL into a browser bar to see what is returned. You'll see something like below which is the JSON that populates the tagged images on lazy load.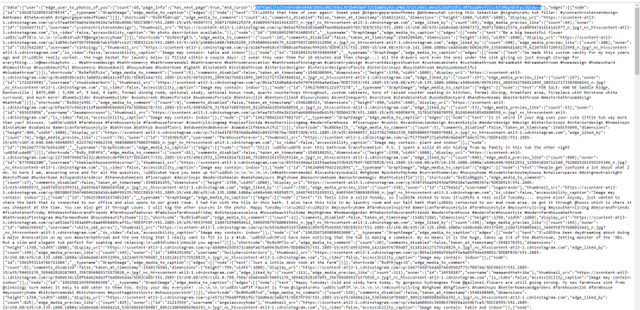
In the picture above, the "endCursor" variable is highlighted. This will come into play later. Then just beyond that is the "edges" array (array values are wrapped in []). This is the meat of your info. You can copy and paste that entire array. It ends with the closing bracket followed by three curly braces and then the "status" variable.
Make the JSON human readable
I know you are thinking, "but Danielle, how are we supposed to pull any insights from this?" It looks like a lot. But as long as data maintains the expected structure you can map values pretty easily. When I was pulling this manually, I used this awesome JSON to CSV converter. However, I built a Google Sheet that using Apps Scripts will GET the data from Instagram and map it into a Sheet for you. I have my last fiscal year IG tags data in Sheets to analyze using Data Studio (and will share in a forthcoming blog post about some of the data analysis I'm doing from all this!)How To Set Up To Pull This Data in Google Sheets
USE THIS SHEET TO AUTOMATE THE PROCESS!In order to start the Sheet, you will need information from that REQUEST URL you pulled from the Dev Tools network tab. Copy everything up through "variables" on that and paste it into A5 of the Sheet. Then in A8 set how many posts you'd like to pull at a time. It seems to cap at 50 and the default is 12 (which is what initially pulled on your REQUEST URL provided there are at least 12 posts to pull). NOTE: if an account goes private after the initial post, it seems to make the "50" less than. Some pulls only generated ~48 posts.
From some digging on Stack Overflow, the variables that IG needs passed to pull the correct data have changed quite a bit. For now, they are passed as a JSON that has been URI encoded. You will need to DECODE it get your account ID. I used this simple encode/decode tool, which you can see it in use below. Get the value with the "id" variable and paste it into A11 on the sheet.

In the image above of the response data in the browser tab, I mentioned we'd come back to the piece that I had highlighted. That's the endCursor which indicates where the next data pull/page should begin. On the sheet, just leave A14 blank and IF there is more data to pull, the endCursor will populate there for you to run the script again starting with where your last pull left off. Pretty sweet huh? While I would have loved to have not made you have to go in and hit "run" again for each pull, the event triggers in Apps Scripts are a little finnicky. Anyone who has a fix for me, I'd appreciate it! But this is still quite simple and fast. I pulled ~2250 posts (which was about 42 clicks) all while writing this blog post and watching a single episode of Handmaid's Tale. Believe me, it was a hell of a lot faster than doing the manual process of copying and pasting into the JSON to CSV, pulling the endCursor, encoding it, pasting the new encoded variables into the browser bar and repeating the process over again. I did that for about ~2400 posts before I finalized the script. So you are welcome!
No comments:
Post a Comment