Monday, January 24, 2022

The Channel Manager’s Best Google Analytics Report

If you manage an acquisition channel—like organic search, paid social, email, etc.—then the Landing Pages Report in Google Analytics should be your best friend if it isn’t already.

What is a landing page

You might call any priority page where you are sending a campaign a “landing page.” However, in Google Analytics, a Landing Page is specifically the dimension that indicates which page a user entered the site. Other tools, like Adobe Analytics, call this an “entry page.” This dimension tells us on what page the user started their session. Thus, this dimension is scoped at a session level, which I’ll explain more about.

What are entrances then?

If you are playing around in Google Analytics, you might also come across the option for “Entrances,” which is a metric that counts the number of times a page served as the first page of the session. Learn more about dimensions and metrics in this guide from Google.

Scope

So, what is a session-level scope? Stecklein from Seer Interactive details the scopes used in Universal Analytics. Those four different scopes for reports are:

  • user
  • session
  • hit
  • product.

Although most of the information within the “Behavior” section of Universal Analytics is hit-based, such as pageviews and events, the Landing Pages report, which is under Site Content, is a session-level scope. This can be confusing because dimensions and metrics can only be paired if they have the correct scope. Google offers a reference guide for these pairings. A good way to determine the scope of your report is to see what metrics are available on it by default.

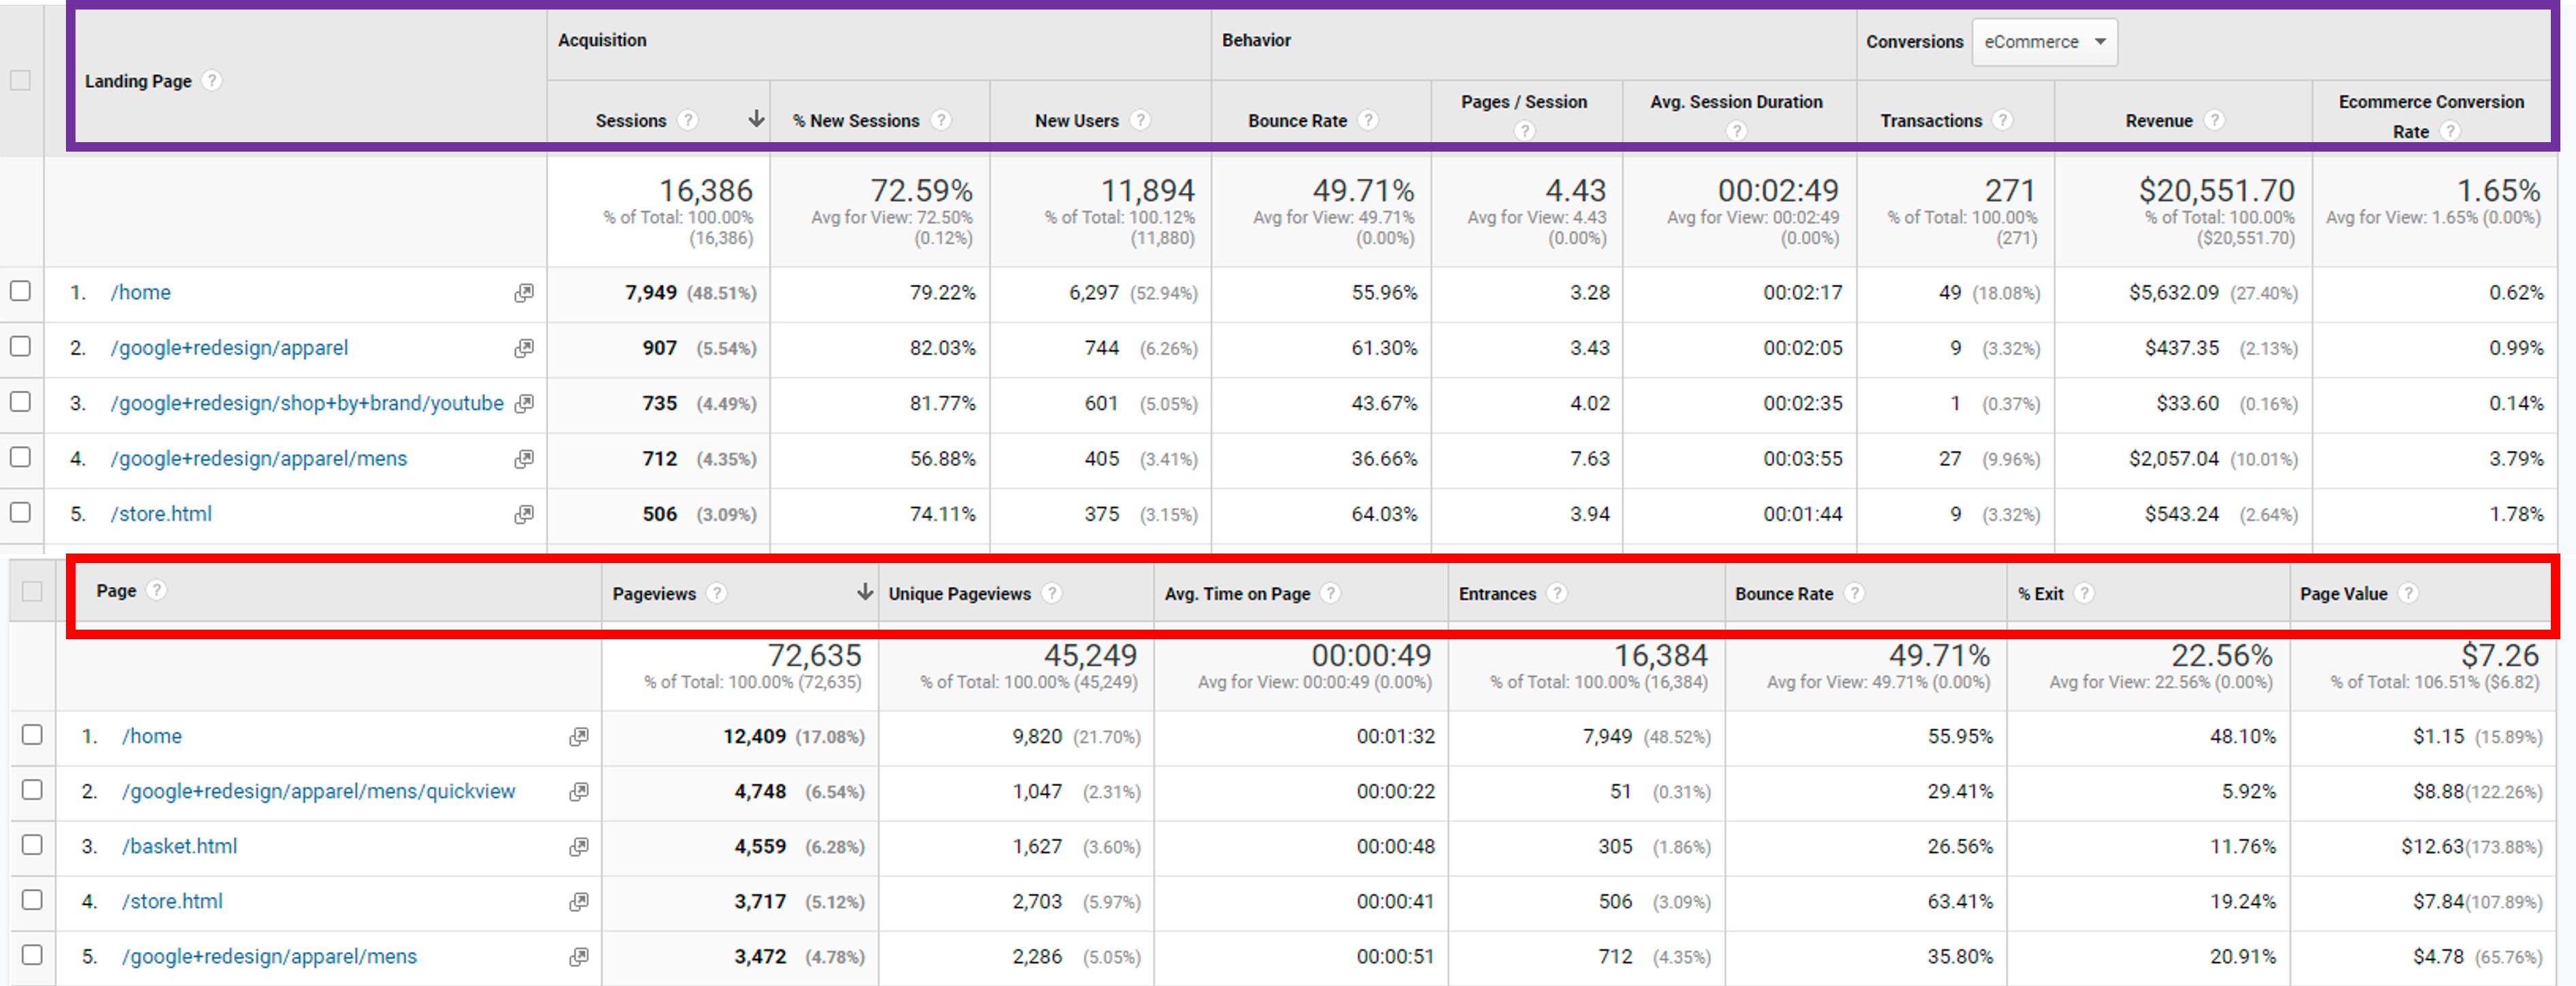
A pageview is a specific hit that sends one request to the server. Page-level reports show metrics like pageviews and time on page. Meanwhile, sessions look at all hits from the beginning of a session starting to its end, when the user exits the site or the session times out. Thus, session-level metrics include sessions, pages per session, and average session duration. Refer to Figure 1 to see the different metrics used in the Landing Page report vs. the All Pages Report. You’ll see in the image the Entrances dimension on the All Pages report, which indicates how many times a session began on that page.

Figure 1

Universal Analytics Landing Page Report vs. All Pages Report (Google Analytics, n.d.)


What about Landing Pages in GA4?

I hope I’ve made it clear that these scopes and the Landing Page report are tied to Universal Analytics. The largest difference with GA4 vs. Universal Analytics is that GA4’s data model doesn’t focus on sessions as Universal does. As such, “landing page” doesn’t exist in GA4. Learn more about the differences with session-level data in GA4 from Bounteous.

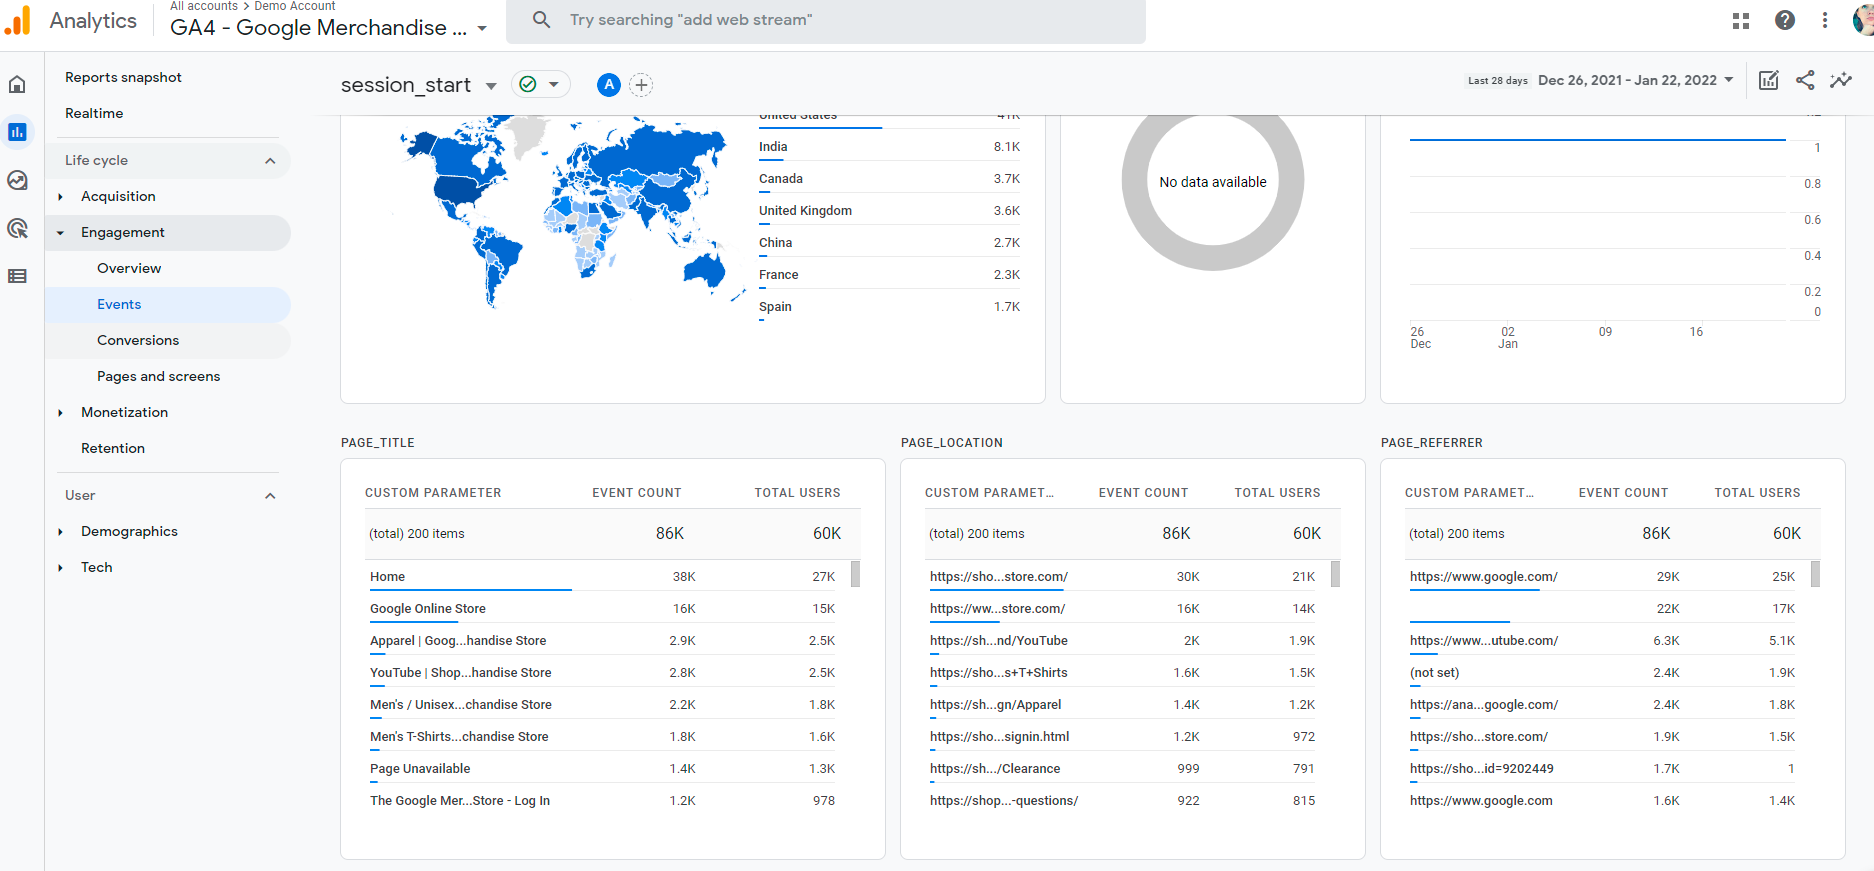
So how can you review landing pages? GA4 has a built-in event/hit of “session_start.” When paired with a page dimension, “session_start” shows which pages users are entering the site. Instead of looking at this as a “page,” you must consider “session_start” as an event. Thus, you can find entrance pages by going to Reports > Lifecycle > Engagement > Events within the GA4 menu. The main Events report shows all the available events. Once you click into the “session_start” event specifically then you can scroll to review the top pages for this event (Figure 2).

Figure 2

“session_start” event report in GA4 (Google Analytics, n.d.)

If you’d like to look more at the page level, then you can use the event metrics to create an “entrances” metric. The reports in GA4 are very lackluster compared to the options available in Universal Analytics, so creating custom dashboards seems to be the better route. Omi Sido explains how to add the session_start event to GA4 page reports and how to create a custom report in the Analysis Hub.

Tips and Tricks

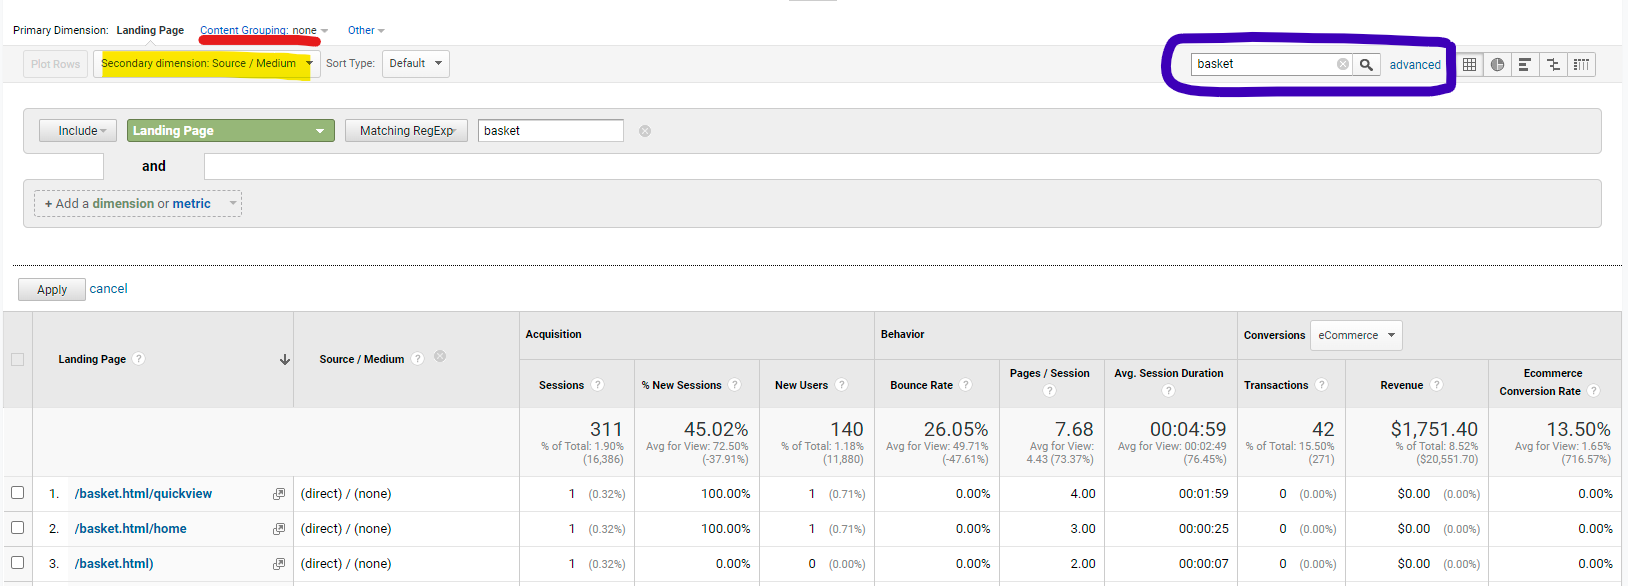
The Landing Page Report can get a little overwhelming if you have a lot of content. If your site doesn’t use Content Grouping (refer to the red line in Figure 3), then you can use Advanced Filtering to filter down to a specific page or group of pages. Basic and Advanced Filtering is pictured in a blue box in Figure 3. Be careful filtering to exact page matches though because query string parameters and inconsistent trailing slashes on pages can cause an extra row for the same page, as seen in Figure 3.

Figure 3

Filtering options within the Landing Page report (Google Analytics, n.d.)

If you are looking to narrow down the report by your acquisition channel, then you can use segments or advanced filtering for that too. Segments are useful when you have a channel or source/medium on which you regularly report. Meanwhile, if you are digging into a more specific referring domain or source/medium, you can also filter by adding a Secondary Dimension, which is highlighted in yellow in Figure 3. Use the Advanced Filter options to select the Secondary Dimension for your filter or the filter will stick to the Primary Dimension as the default.

Thursday, January 20, 2022

Why Bounce Rate is a Terrible Benchmark

Are you measuring how your site or site section’s bounce rate compares to other sites? Don’t! Bounce rate is incredibly hard to standardize, not only across websites but also across your website, and acquisition channels. One of the major reasons for this issue is a poor understanding of bounce rate.

What is a bounce

The bounce and bounce rate definitions may be different depending on where you get your information. The Web Analytics Association defines a bounce as “a visit with one pageview.” Despite that being under a “Google Analytics Glossary” page, that definition is not aligned with how Google Analytics determines a bounce. Forget what anyone else, even your boss, says; go to your analytics provider to understand how it determines a bounce.

Google explains that in Google Analytics a bounce is calculated as a session that triggers only a single request to the Analytics server. When the page loads, a pageview request is sent to the server but requests other than pageviews, called interaction hits, can be sent from the same page, too. Imagine a user that visits a page that begins playing a video once the user has scrolled it into the frame. The user enters the site on that page, scrolls far enough for the video to start playing, scrolls past the video without watching, and exits the page. Is that a bounce? Depending on how your site is tracking the video event or any other on-page events, it may or may not be considered a bounce.

Events in Google Analytics default as “interaction hits.” When an interaction hit occurs in addition to the initial pageview, then the visit, or session, is not a bounce. If you are using events to track the video play, that event is likely kept to the default interaction hit, which means the user scrolling past it without watching and immediately leaving would NOT be a bounce. However, events can be set as “non-interaction hits” by setting the “non-interaction hit” parameter to “true.” Learn how to set the parameter to true in Google Tag Manager or with a hard-coded analytics.js or ga.js script.

How to properly benchmark bounce rate

Would you or your organization consider auto-played videos an interaction? What if competitors do and you don’t or vice versa? How might other pages on your website appear from an engagement standpoint if they don’t have automatic video plays bringing down the bounce count? Because sites and even pages within the same site can serve such different purposes, we shouldn’t be comparing bounces and bounce rate to other pages. CXL explains how two different sites (or sections on the same site)—a blog and an informational page—will have very different bounce rates because of how they serve the user’s intent. So what is bounce rate good for? You can use bounce rate as a metric to help improve the specific page.

Even when benchmarking the same page there are some caveats. Be sure events that aren’t triggered by a user interaction are not set to the default “interaction hit” to unnaturally set the bounce rate low. Some examples are auto-played videos, scroll tracking, and banner ad views. Toggling content, like an accordion or tab, is another one to set clear expectations for interaction hit, or not, and make sure that is consistent across the site. Another caveat to setting a standard or bounce rate goal for a single page is to consider how the acquisition channels might be affecting those bounces. From the CXL article again, a poor bounce rate from one acquisition channel might signal that the message is not providing the right context or is being presented to the wrong audience. A bad ad or ad targeting could raise the bounce rate making it seem as though the page is subpar.

In case you couldn’t tell, I don’t care much for bounces and bounce rate, and don’t include those in reporting. Happily, with GA4 we won’t even have to worry about it! Bounces and bounce rate do not exist in GA4 and instead are replaced with engaged sessions and engagement rate. I love Krista Seiden’s definition of engagement rate as an “inversion” of bounce rate, “measuring active interaction rather than the lack of it.” If you aren’t ready or just don’t like GA4 (yet), consider taking its engagement measurement as a way to better define engagement with the data available in Universal Analytics. Engaged sessions are those when the session

  • has lasted more than 10 seconds
  • resulted in a conversion event
  • had two or more page/screen views.

Some ways to analyze those in Universal Analytics are to look at the other engagement metrics, like average time on page when looking at page-level data or average session duration and goal completion/conversions when reviewing session-level data, like the Landing Pages report (which I’ll be talking about in my next post).