If you manage an acquisition channel—like organic search, paid social, email, etc.—then the Landing Pages Report in Google Analytics should be your best friend if it isn’t already.
What is a landing page
You might call any priority page where you are sending a campaign a “landing page.” However, in Google Analytics, a Landing Page is specifically the dimension that indicates which page a user entered the site. Other tools, like Adobe Analytics, call this an “entry page.” This dimension tells us on what page the user started their session. Thus, this dimension is scoped at a session level, which I’ll explain more about.
What are entrances then?
If you are playing around in Google Analytics, you might also come across the option for “Entrances,” which is a metric that counts the number of times a page served as the first page of the session. Learn more about dimensions and metrics in this guide from Google.
Scope
So, what is a session-level scope? Stecklein from Seer Interactive details the scopes used in Universal Analytics. Those four different scopes for reports are:
- user
- session
- hit
- product.
Although most of the information within the “Behavior” section of Universal Analytics is hit-based, such as pageviews and events, the Landing Pages report, which is under Site Content, is a session-level scope. This can be confusing because dimensions and metrics can only be paired if they have the correct scope. Google offers a reference guide for these pairings. A good way to determine the scope of your report is to see what metrics are available on it by default.
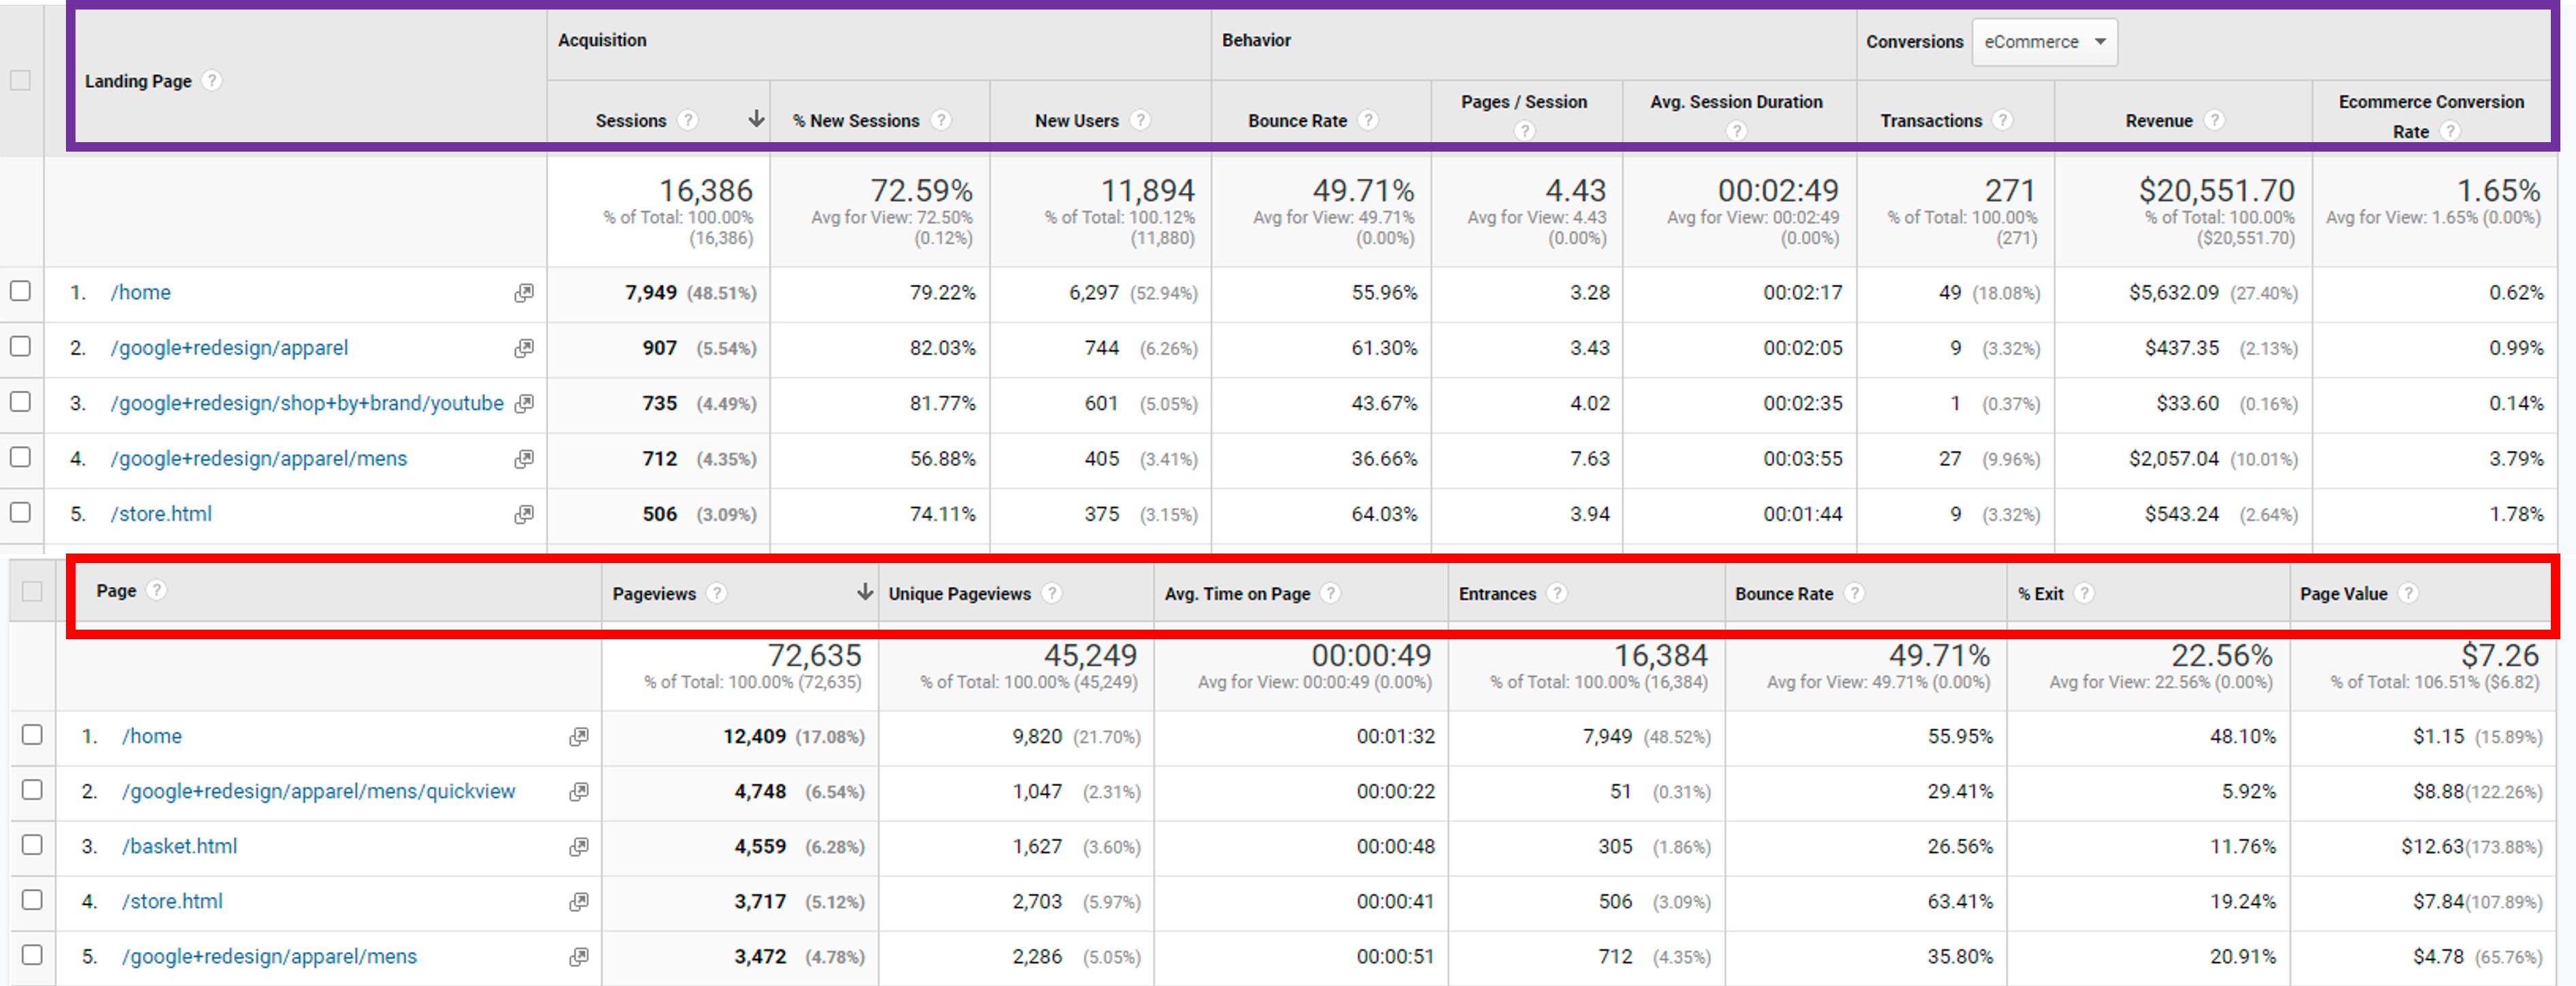
A pageview is a specific hit that sends one request to the server. Page-level reports show metrics like pageviews and time on page. Meanwhile, sessions look at all hits from the beginning of a session starting to its end, when the user exits the site or the session times out. Thus, session-level metrics include sessions, pages per session, and average session duration. Refer to Figure 1 to see the different metrics used in the Landing Page report vs. the All Pages Report. You’ll see in the image the Entrances dimension on the All Pages report, which indicates how many times a session began on that page.
Figure 1
Universal Analytics Landing Page Report vs. All Pages Report (Google Analytics, n.d.)
What about Landing Pages in GA4?
I hope I’ve made it clear that these scopes and the Landing Page report are tied to Universal Analytics. The largest difference with GA4 vs. Universal Analytics is that GA4’s data model doesn’t focus on sessions as Universal does. As such, “landing page” doesn’t exist in GA4. Learn more about the differences with session-level data in GA4 from Bounteous.
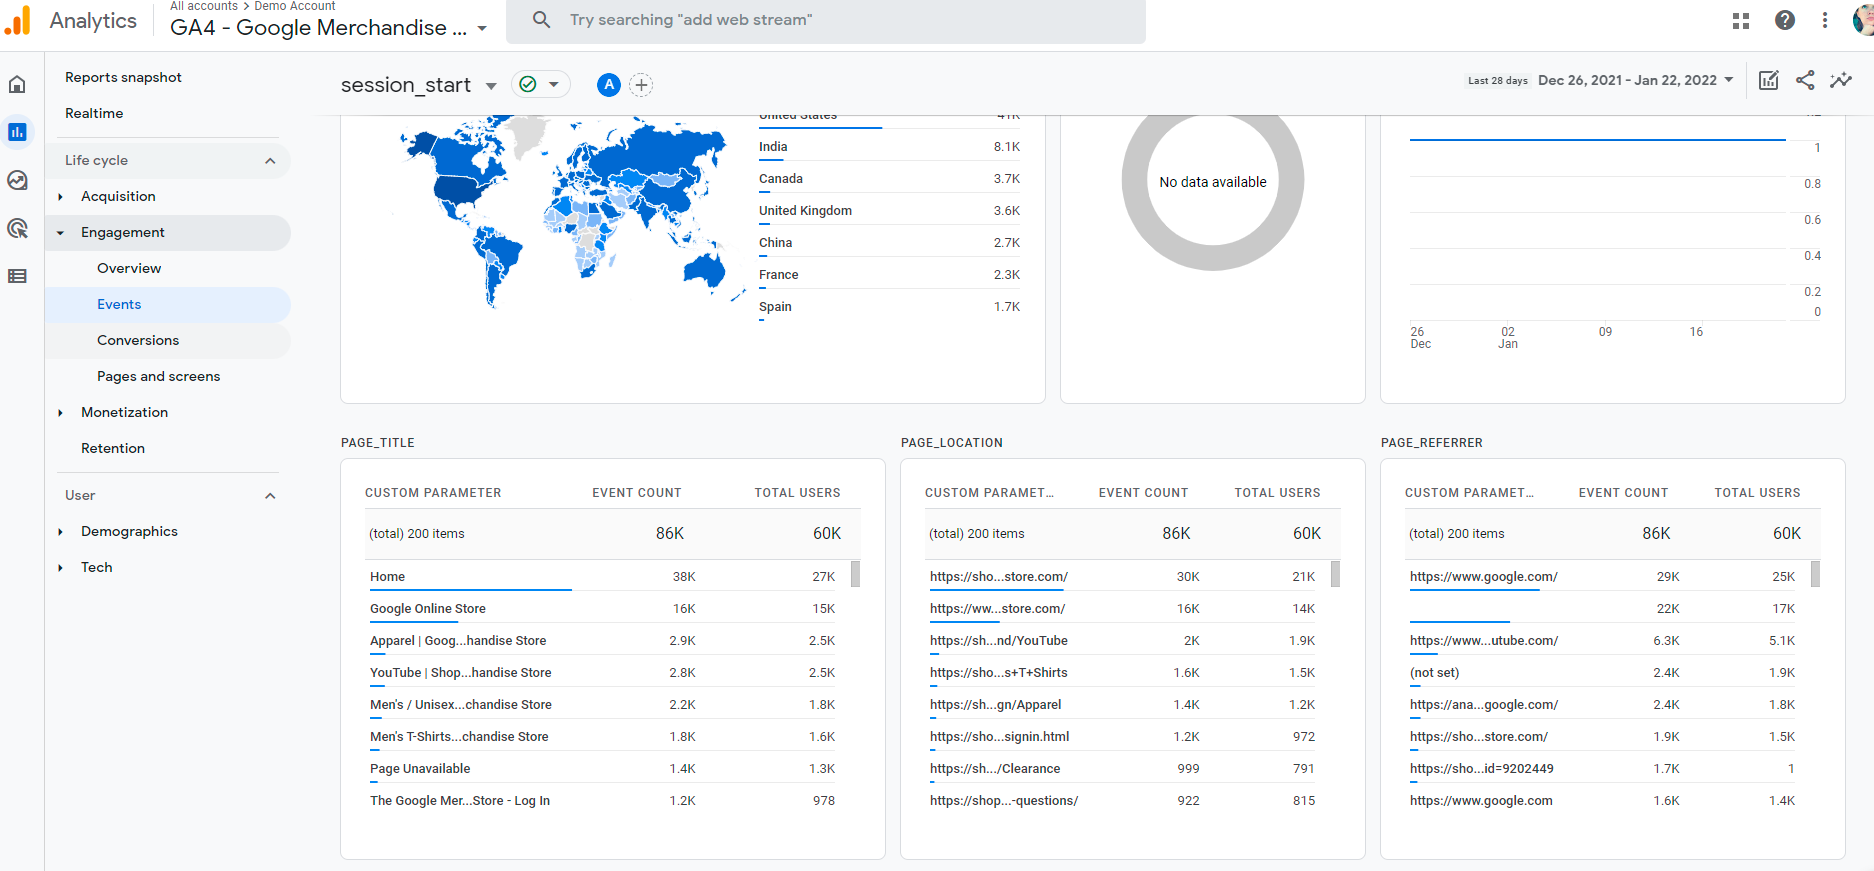
So how can you review landing pages? GA4 has a built-in event/hit of “session_start.” When paired with a page dimension, “session_start” shows which pages users are entering the site. Instead of looking at this as a “page,” you must consider “session_start” as an event. Thus, you can find entrance pages by going to Reports > Lifecycle > Engagement > Events within the GA4 menu. The main Events report shows all the available events. Once you click into the “session_start” event specifically then you can scroll to review the top pages for this event (Figure 2).
Figure 2
“session_start” event report in GA4 (Google Analytics, n.d.)
If you’d like to look more at the page level, then you can use the event metrics to create an “entrances” metric. The reports in GA4 are very lackluster compared to the options available in Universal Analytics, so creating custom dashboards seems to be the better route. Omi Sido explains how to add the session_start event to GA4 page reports and how to create a custom report in the Analysis Hub.
Tips and Tricks
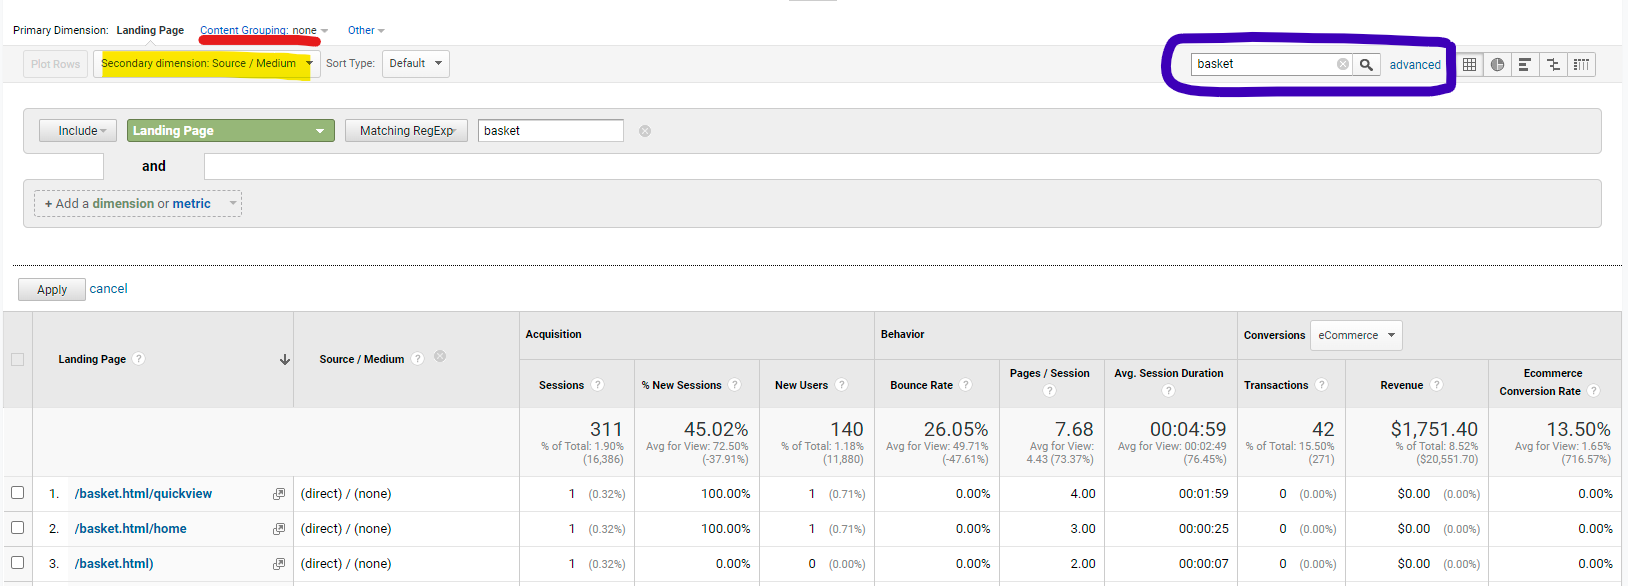
The Landing Page Report can get a little overwhelming if you have a lot of content. If your site doesn’t use Content Grouping (refer to the red line in Figure 3), then you can use Advanced Filtering to filter down to a specific page or group of pages. Basic and Advanced Filtering is pictured in a blue box in Figure 3. Be careful filtering to exact page matches though because query string parameters and inconsistent trailing slashes on pages can cause an extra row for the same page, as seen in Figure 3.
Figure 3
Filtering options within the Landing Page report (Google Analytics, n.d.)
If you are looking to narrow down the report by your acquisition channel, then you can use segments or advanced filtering for that too. Segments are useful when you have a channel or source/medium on which you regularly report. Meanwhile, if you are digging into a more specific referring domain or source/medium, you can also filter by adding a Secondary Dimension, which is highlighted in yellow in Figure 3. Use the Advanced Filter options to select the Secondary Dimension for your filter or the filter will stick to the Primary Dimension as the default.


I liked that you used GA4 here. You highlighted some key differences and hopefully, that will help some people look at GA4 differently.
ReplyDeleteDanielle, great job with the layout of your blog! The information you included here was very helpful and you broke it down in such a way for many people to understand it. Great post!
ReplyDelete