Monday, January 24, 2022

The Channel Manager’s Best Google Analytics Report

If you manage an acquisition channel—like organic search, paid social, email, etc.—then the Landing Pages Report in Google Analytics should be your best friend if it isn’t already.

What is a landing page

You might call any priority page where you are sending a campaign a “landing page.” However, in Google Analytics, a Landing Page is specifically the dimension that indicates which page a user entered the site. Other tools, like Adobe Analytics, call this an “entry page.” This dimension tells us on what page the user started their session. Thus, this dimension is scoped at a session level, which I’ll explain more about.

What are entrances then?

If you are playing around in Google Analytics, you might also come across the option for “Entrances,” which is a metric that counts the number of times a page served as the first page of the session. Learn more about dimensions and metrics in this guide from Google.

Scope

So, what is a session-level scope? Stecklein from Seer Interactive details the scopes used in Universal Analytics. Those four different scopes for reports are:

  • user
  • session
  • hit
  • product.

Although most of the information within the “Behavior” section of Universal Analytics is hit-based, such as pageviews and events, the Landing Pages report, which is under Site Content, is a session-level scope. This can be confusing because dimensions and metrics can only be paired if they have the correct scope. Google offers a reference guide for these pairings. A good way to determine the scope of your report is to see what metrics are available on it by default.

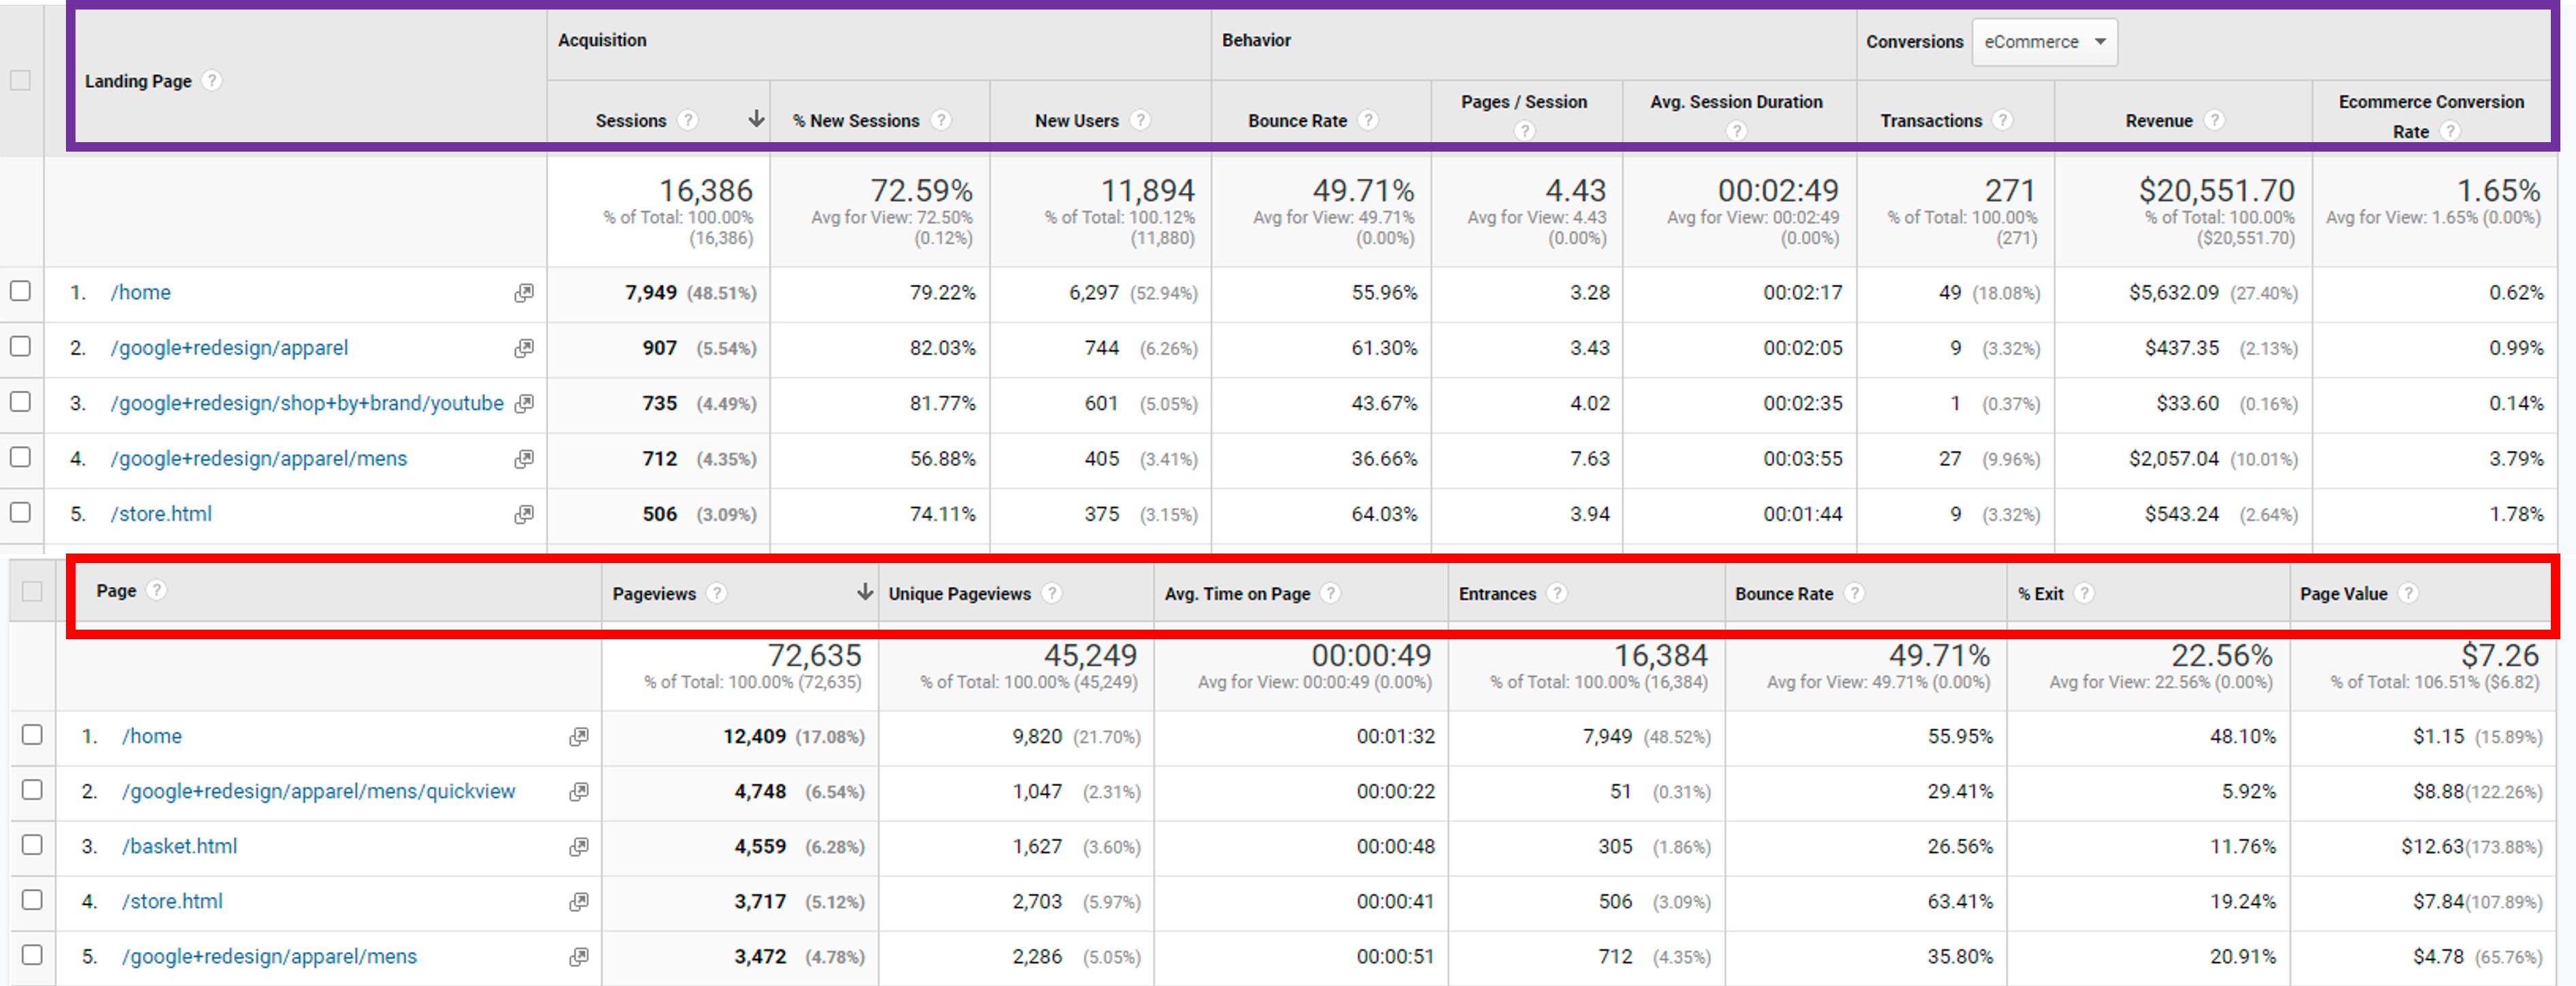
A pageview is a specific hit that sends one request to the server. Page-level reports show metrics like pageviews and time on page. Meanwhile, sessions look at all hits from the beginning of a session starting to its end, when the user exits the site or the session times out. Thus, session-level metrics include sessions, pages per session, and average session duration. Refer to Figure 1 to see the different metrics used in the Landing Page report vs. the All Pages Report. You’ll see in the image the Entrances dimension on the All Pages report, which indicates how many times a session began on that page.

Figure 1

Universal Analytics Landing Page Report vs. All Pages Report (Google Analytics, n.d.)


What about Landing Pages in GA4?

I hope I’ve made it clear that these scopes and the Landing Page report are tied to Universal Analytics. The largest difference with GA4 vs. Universal Analytics is that GA4’s data model doesn’t focus on sessions as Universal does. As such, “landing page” doesn’t exist in GA4. Learn more about the differences with session-level data in GA4 from Bounteous.

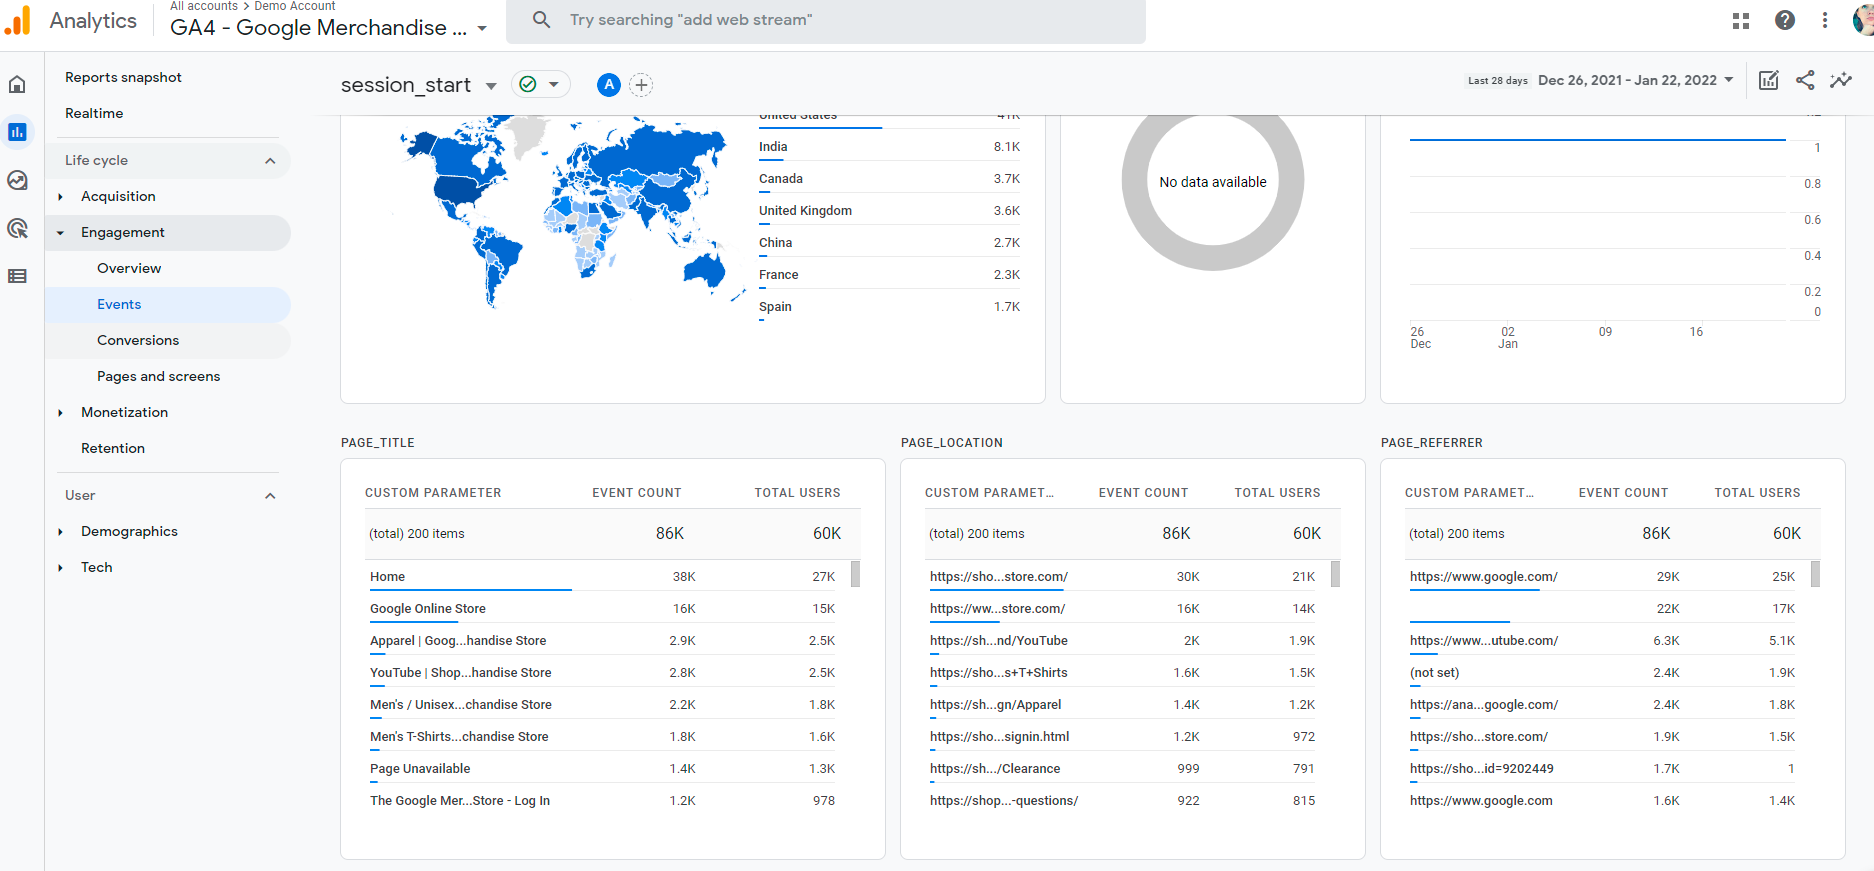
So how can you review landing pages? GA4 has a built-in event/hit of “session_start.” When paired with a page dimension, “session_start” shows which pages users are entering the site. Instead of looking at this as a “page,” you must consider “session_start” as an event. Thus, you can find entrance pages by going to Reports > Lifecycle > Engagement > Events within the GA4 menu. The main Events report shows all the available events. Once you click into the “session_start” event specifically then you can scroll to review the top pages for this event (Figure 2).

Figure 2

“session_start” event report in GA4 (Google Analytics, n.d.)

If you’d like to look more at the page level, then you can use the event metrics to create an “entrances” metric. The reports in GA4 are very lackluster compared to the options available in Universal Analytics, so creating custom dashboards seems to be the better route. Omi Sido explains how to add the session_start event to GA4 page reports and how to create a custom report in the Analysis Hub.

Tips and Tricks

The Landing Page Report can get a little overwhelming if you have a lot of content. If your site doesn’t use Content Grouping (refer to the red line in Figure 3), then you can use Advanced Filtering to filter down to a specific page or group of pages. Basic and Advanced Filtering is pictured in a blue box in Figure 3. Be careful filtering to exact page matches though because query string parameters and inconsistent trailing slashes on pages can cause an extra row for the same page, as seen in Figure 3.

Figure 3

Filtering options within the Landing Page report (Google Analytics, n.d.)

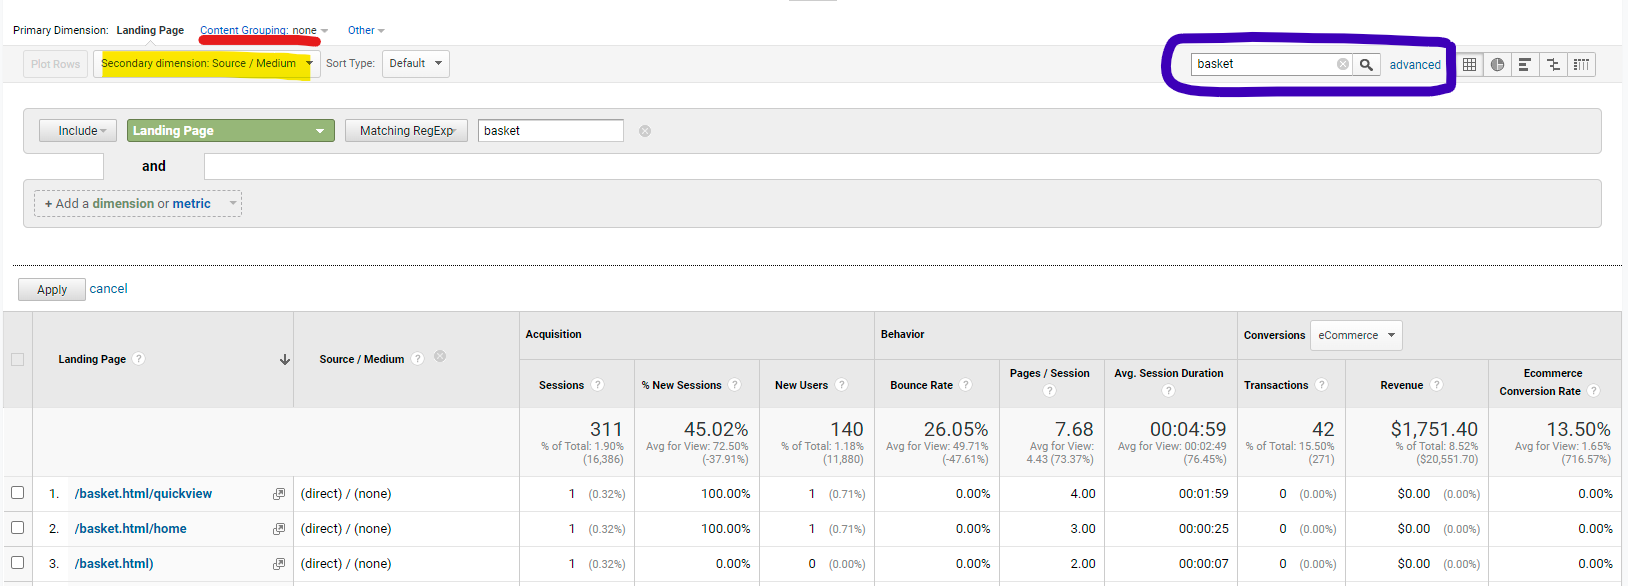
If you are looking to narrow down the report by your acquisition channel, then you can use segments or advanced filtering for that too. Segments are useful when you have a channel or source/medium on which you regularly report. Meanwhile, if you are digging into a more specific referring domain or source/medium, you can also filter by adding a Secondary Dimension, which is highlighted in yellow in Figure 3. Use the Advanced Filter options to select the Secondary Dimension for your filter or the filter will stick to the Primary Dimension as the default.

Thursday, January 20, 2022

Why Bounce Rate is a Terrible Benchmark

Are you measuring how your site or site section’s bounce rate compares to other sites? Don’t! Bounce rate is incredibly hard to standardize, not only across websites but also across your website, and acquisition channels. One of the major reasons for this issue is a poor understanding of bounce rate.

What is a bounce

The bounce and bounce rate definitions may be different depending on where you get your information. The Web Analytics Association defines a bounce as “a visit with one pageview.” Despite that being under a “Google Analytics Glossary” page, that definition is not aligned with how Google Analytics determines a bounce. Forget what anyone else, even your boss, says; go to your analytics provider to understand how it determines a bounce.

Google explains that in Google Analytics a bounce is calculated as a session that triggers only a single request to the Analytics server. When the page loads, a pageview request is sent to the server but requests other than pageviews, called interaction hits, can be sent from the same page, too. Imagine a user that visits a page that begins playing a video once the user has scrolled it into the frame. The user enters the site on that page, scrolls far enough for the video to start playing, scrolls past the video without watching, and exits the page. Is that a bounce? Depending on how your site is tracking the video event or any other on-page events, it may or may not be considered a bounce.

Events in Google Analytics default as “interaction hits.” When an interaction hit occurs in addition to the initial pageview, then the visit, or session, is not a bounce. If you are using events to track the video play, that event is likely kept to the default interaction hit, which means the user scrolling past it without watching and immediately leaving would NOT be a bounce. However, events can be set as “non-interaction hits” by setting the “non-interaction hit” parameter to “true.” Learn how to set the parameter to true in Google Tag Manager or with a hard-coded analytics.js or ga.js script.

How to properly benchmark bounce rate

Would you or your organization consider auto-played videos an interaction? What if competitors do and you don’t or vice versa? How might other pages on your website appear from an engagement standpoint if they don’t have automatic video plays bringing down the bounce count? Because sites and even pages within the same site can serve such different purposes, we shouldn’t be comparing bounces and bounce rate to other pages. CXL explains how two different sites (or sections on the same site)—a blog and an informational page—will have very different bounce rates because of how they serve the user’s intent. So what is bounce rate good for? You can use bounce rate as a metric to help improve the specific page.

Even when benchmarking the same page there are some caveats. Be sure events that aren’t triggered by a user interaction are not set to the default “interaction hit” to unnaturally set the bounce rate low. Some examples are auto-played videos, scroll tracking, and banner ad views. Toggling content, like an accordion or tab, is another one to set clear expectations for interaction hit, or not, and make sure that is consistent across the site. Another caveat to setting a standard or bounce rate goal for a single page is to consider how the acquisition channels might be affecting those bounces. From the CXL article again, a poor bounce rate from one acquisition channel might signal that the message is not providing the right context or is being presented to the wrong audience. A bad ad or ad targeting could raise the bounce rate making it seem as though the page is subpar.

In case you couldn’t tell, I don’t care much for bounces and bounce rate, and don’t include those in reporting. Happily, with GA4 we won’t even have to worry about it! Bounces and bounce rate do not exist in GA4 and instead are replaced with engaged sessions and engagement rate. I love Krista Seiden’s definition of engagement rate as an “inversion” of bounce rate, “measuring active interaction rather than the lack of it.” If you aren’t ready or just don’t like GA4 (yet), consider taking its engagement measurement as a way to better define engagement with the data available in Universal Analytics. Engaged sessions are those when the session

  • has lasted more than 10 seconds
  • resulted in a conversion event
  • had two or more page/screen views.

Some ways to analyze those in Universal Analytics are to look at the other engagement metrics, like average time on page when looking at page-level data or average session duration and goal completion/conversions when reviewing session-level data, like the Landing Pages report (which I’ll be talking about in my next post).

Friday, August 9, 2019

Create a Sheet of All The Instagram Posts You Are Tagged In

Don't worry I've automated scraping your tagged Instagram posts for you!

If you do any work around Instagram, you know that the "Tagged" photos on your profile is a gold mine of insights! These are your brand advocates speaking about your products. Understanding the frequency and timing of their sharing, what they are saying about your brand, what hashtags they are using is SO useful to helping you craft your brand messaging and approach on Instagram. But aside from clicking through every single image, how can you digest all of that information? By scraping their JSON of course!

Figure Out How Instagram Generates Your Tagged Feed

When on your Tagged page, instagram.com/[yourhandlehere]/tagged, right click in your browser to Inspect or open your dev tools. Select the "Network" tab, filter to the XHR. Once you start scrolling to populate new images from the initial 12 that loaded you should see a call with the name "?query_hash=..." Select that network call to get the full REQUEST URL.

So What Is All This?

Go ahead and copy and paste that REQUEST URL into a browser bar to see what is returned. You'll see something like below which is the JSON that populates the tagged images on lazy load.

In the picture above, the "endCursor" variable is highlighted. This will come into play later. Then just beyond that is the "edges" array (array values are wrapped in []). This is the meat of your info. You can copy and paste that entire array. It ends with the closing bracket followed by three curly braces and then the "status" variable.

Make the JSON human readable

I know you are thinking, "but Danielle, how are we supposed to pull any insights from this?" It looks like a lot. But as long as data maintains the expected structure you can map values pretty easily. When I was pulling this manually, I used this awesome JSON to CSV converter. However, I built a Google Sheet that using Apps Scripts will GET the data from Instagram and map it into a Sheet for you. I have my last fiscal year IG tags data in Sheets to analyze using Data Studio (and will share in a forthcoming blog post about some of the data analysis I'm doing from all this!)

How To Set Up To Pull This Data in Google Sheets

USE THIS SHEET TO AUTOMATE THE PROCESS!
In order to start the Sheet, you will need information from that REQUEST URL you pulled from the Dev Tools network tab. Copy everything up through "variables" on that and paste it into A5 of the Sheet. Then in A8 set how many posts you'd like to pull at a time. It seems to cap at 50 and the default is 12 (which is what initially pulled on your REQUEST URL provided there are at least 12 posts to pull). NOTE: if an account goes private after the initial post, it seems to make the "50" less than. Some pulls only generated ~48 posts.

From some digging on Stack Overflow, the variables that IG needs passed to pull the correct data have changed quite a bit. For now, they are passed as a JSON that has been URI encoded. You will need to DECODE it get your account ID. I used this simple encode/decode tool, which you can see it in use below. Get the value with the "id" variable and paste it into A11 on the sheet.

In the image above of the response data in the browser tab, I mentioned we'd come back to the piece that I had highlighted. That's the endCursor which indicates where the next data pull/page should begin. On the sheet, just leave A14 blank and IF there is more data to pull, the endCursor will populate there for you to run the script again starting with where your last pull left off. Pretty sweet huh? While I would have loved to have not made you have to go in and hit "run" again for each pull, the event triggers in Apps Scripts are a little finnicky. Anyone who has a fix for me, I'd appreciate it! But this is still quite simple and fast. I pulled ~2250 posts (which was about 42 clicks) all while writing this blog post and watching a single episode of Handmaid's Tale. Believe me, it was a hell of a lot faster than doing the manual process of copying and pasting into the JSON to CSV, pulling the endCursor, encoding it, pasting the new encoded variables into the browser bar and repeating the process over again. I did that for about ~2400 posts before I finalized the script. So you are welcome!

Sunday, June 16, 2019

How To Write How-To Structured Data for Google SERPs

I know that there is a lot of debate in the SEO world about succumbing to Google's rich results options. If you give your content to Google, you are giving away clicks. Or so they say (and some have seen happen). However, that has NOT been the case as I've seen it so far with the pages I've implemented HowTo structured data. As you'll see in the examples below, I believe the How-to rich results do a good job of encouraging the user to continue through to the website

As of May 9th (the day after the I/O announcement of recognizing How-To as a SERP feature), I had two articles showing up.

Comparing the 30 days prior and the 30 days after:

  • 15% increase in impressions
  • 4% increase in clicks
While overall CTR slightly dropped, average CTR within the How-to rich results was 6% higher than the overall average of those pages from the 30 days prior. Another aside is when checking on Google Home devices (NOT with video), the article was winning in voice search results.

I'll spare you all the nitty gritty details. But some old code and odd layout structure in comparison to how things are nested in the HowTo, meant that trying to make the microdata work was just too much. I couldn't properly nest images within the HowToStep, so I had to use the "standard" set up, not the one for images with each step. Something to note from that is if you have an image nested inside of the HowToDirection, then you have to be sure to use the "beforeMedia," "duringMedia," or "afterMedia" itemprop instead of "image."


After all that, I gave the JSON-LD set up a try this week on another article. Now I am a total believer in the JSON-LD. I didn't have to worry at all about how the page was structured (I don't want to mess with any layout/design or copy so I don't have to go through a new approval process).


So as not to be one of those recipe blogs everyone hates, let me get to the real deal here. Below I've shared a link to VIEW a Google Sheets I built with Google Apps Scripts that will allow you to input names, descriptions, image URLs, etc only into some cells. Then run my scripts to generate the appropriate JSON-LD for the How-to rich result with images for each step.

Google Sheet to Generate How-to Schema JSON-LD

Don't forget to make a copy of that sheet in order to edit it for your needs! Let me know if you have any feedback or questions


I already used it to set up another article, tested the script, updated the site, asked for a priority reindex, and here it is already in the results. From creating the JSON-LD to showing up in the mobile SERP, all within an hour!


Monday, June 3, 2019

Using Keyword Research for Product Development

"Unprecedented success." That's what the company is calling a new product launch this January that I discovered as an opportunity in keyword research back in September 2017. Back then I wasn't even TRYING to find the next big product; I was doing some keyword research in Moz Keyword Explorer to optimize a buying guide. Thankfully, buying guides cover a broad range of queries around a product category. I tend to start with a head term and let the "Keyword Opportunities" guide me on long-tail terms that might be a worthwhile ranking opportunity.

While I usually log and analyze keywords that have some search volume aside from "n/a" and a relatively low difficulty and high organic CTR (color scales make this easier for humans to spot in large keyword lists!), this product opportunity was sitting near the top when sorting by largest search volume, with monthly searches ranging from 1701-2900 searches per month (in the pictured March 2019 analysis it was the second listed, now at 2901-4300). When I gave those numbers to the product manager, they didn't need any comparison to know that seemed like a good find. What made it even better was that when I pulled up the SERP to analyze the competition there was almost no competitor actually offering it -- one small niche shop and then the big retail competitors own site search pages with no truly relevant results.

Like organic optimization, new product development can take a lot of time. Sometimes in that time, trends change and interest starts dropping off. You don't want your production time to put you in the downtrend. While Moz Keyword Explorer doesn't show trends, keeping keyword lists, exporting them, and saving them down with the Date Analyzed allows you to create trend graphs. To try to get way ahead of consumer interest, we now do regular reports on social media insights and influencer requests to help identify trends before they've really hit general consumers.

Now I've encouraged (and, of course, trained) the product development team to try to do the same in Keyword Explorer to check against new product ideas they are considering. To understand how these new opportunities measure up, comparing them to a similar term in the category that we are already optimized for helps. Google Ads can bring in some additional insight on those keywords and possibly show a trend if it has remained in an ad group for a while.

Monday, April 22, 2019

Selecting the Right Influencer Campaigns - Part 3 of Influencer Marketing for Brands

Working in an industry where the products offered usually requires a professional installation or at least a very savvy DIYer, my ability to reach out to influencers is limited. While I have ideas to find an influential person that is into entertaining to redo a wet bar or upgrade from a bar cart, without the budget and resources to provide the contracting and installation, I have to wait for the right opportunity to present itself. Unfortunately, a lot of not-so-great opportunities do instead. So it can take a lot to find the best influencer campaign for the brand and understand how to value it when some requests are more than $10k in product due to the high value of the brand's items.
 With budgets tightening and more requests coming in, we need to be selective. So how do you do that with some level of certainty beyond just intuition? When preparing for a meeting with the C-suite I knew the "it depends on the project each time" response wouldn't fly, so I used the process I've applied in prioritizing digital projects in previous roles to create a "vetting system" for our influencer requests. Using this project prioritization matrix guide from the Office of Quality Improvement at University of Wisconsin-Madison , our team that selects influencer campaigns established criteria to rank the project requests. All criteria is based on giving it a 0, 3, 6, or 9 score, which makes structuring your criteria difficult at times. For instance, when deciding if the request includes a priority product of ours, I set up that 0 is not a priority category or product and is something commonly requested (as in we've already done several campaigns around it), 3 is a priority product but is commonly requested, 6 is not a priority product but is not commonly requested, 9 is a priority product and is not commonly requested. Other criteria based around our goals, like image quality to ensure we will have content we will want to reuse and likelihood of getting additional coverage from third-parties (the influencer has a history of doing good PR for themselves, getting back links, etc), and how well we can pull off the project, such as the level of effort going into the project based on timing, scope, etc. We also put engagements and followers into one of the 0,3,6,9 rankings as well, but you will see how these numbers relate to establishing value more so.
 While that all helps to determine which influencer project to prioritize when you can only do a few in a year, how do you know how much value to give them? We took to our own social media accounts to understand the value of a post. While many influencers might go by a $1,000 per 100k followers, we know from our own accounts that not everyone who follows you sees your organic posts, so we got an average percentage of accounts that follow us reached per post, ~30%. Then we analyzed our typical cost per impression (CPM) on boosted posts to assign a dollar value. So if an influencer has 250k followers, while they'd say the should get $2,500 in value, we'd adjust that their organic post would only reach 75k followers and apply our CPM (let's say $5 per 1k) to see what that value equates to - only $375. Then AVERAGE that with the standard influencers use. It doesn't stop there. Because we always ask for imagery to use, we also pad in a typical royalty-free image rights cost for each individual VIGNETTE (not image if they are all the same products/space with just different angles or propping) we'd receive. That'd be the retail value budget we'd give a project that we decided to prioritize.
I had us test this against Kylie Jenner as the last I had heard she was charging $1m per Instagram post when she had 111m followers (her following was over 132m at the time of writing this though). Applying the $1k per 100k followers, she's undervaluing herself slightly because she'd technically be getting $1,110,000 at that following count (whether influencers actually get $1k per 100k is questionable but that's a standard request). However, when accounting that only about 30% of her followers might see a post then we'd say 33,300,000 impressions X $5 per 1k impressions is only $166,500. By then averaging the two, we'd be okay (but not like we would) with valuing a post from her at ~$640,000. I doubt she allows royalty-free use of her images so the extra ~$300 wouldn't be added into that either. 
Note that I titled this selecting the right influencer campaign. While someone might be a great influencer, the project just might not be a fit for the brand at the time. (For us, priority products change as part of our promotional plans, and resources to execute on the campaign for a larger scope or shorter timeline might not be available). As indicated throughout this series, I wish some influencers would understand that a little better when facing rejection. It really isn't personal, and I think this matrix and system for valuing the project helps to take some of that personal bias out of it and provide a tangible way to communicate the process to executives.

Thursday, January 3, 2019

Measuring Your Influencer Marketing - Part 2 of Influencer Marketing for Brands

Before we can talk about finding the right influencers, we need to know what we want to accomplish with these types of campaigns and how to measure your accomplishments.

What's your goal for influencer marketing?

Generate awareness, drive sales, build loyalty, create an advantage over your competitors? Here's one that you might not immediately consider, but should be a major key for partaking in influencer marketing - generating content that you otherwise might not be able to due to budget, talent, or limited resources.

And what about product improvement or development? These are people tuned into what is trending, so their feedback can help your product research. A case study presented in Adweek's Sound Influencer Marketing Webinar indicated a company that had a lot of success sharing product information under an NDA (which I'll get to in a future post) before it hit the market to get useful feedback. While I haven't run any specific research, the insights from what influencers are asking for and feedback to products I share that might work for their project but haven't yet hit the market has been very useful to our product development. You don't have to pick just one of these goals, and different influencer campaigns might focus on one goal while others do another.

As for that competitive advantage, you might consider (but not really measure) how by choosing to go with an influencer you have boxed out the opportunity for your competition to be present in that space. Not a great strategy, but a nice added value to consider as you plan campaigns and what products you might push.

How will you measure your goal?

Reach/Impressions

Reach, impressions, and views make for an easy metric to request. Unfortunately, most everyone who has completed my influencer request form confuses hits and impressions with their follower count. Anyone with a social account knows that your individual posts do not reach your entire audience, not even with some advertising dollars behind it. Requesting screenshots (and some of the more professional influencers do this without even asking) could help keep people more honest, but gaming the system is still a problem with these metrics, as mentioned in Tara Hunt's post Impressions, Reach, Views and Clicks are BS Metrics and I touched on back in 2012 specifically tied to some Facebook advertising I was doing. While Tara Hunt speaks to generating leads based on quality instead of quantity, these are universal metrics, as she puts it "everyone is in on the view/click/fraud scandal," that make them easier to measure and benchmark, especially if your goal is awareness. But consider some of the less easy ways you can indicate awareness and even loyalty.

Since starting influencer marketing, predominantly with campaigns on Instagram, our followership grew 340% in a year - that is continued brand awareness potentially leading to loyalty of highly engaged followers we've acquired. But not all of that growth is completely attributed to influencers as social ads and a strategic theme played a role, which makes it a bit tougher to attribute following increases and engagement. It's great though seeing a whole bunch of new followers in your notifications to see shortly before an influencer posted something.

Website Traffic and Conversions

Although traffic can go back to some of that scandal mentioned in the previous metrics,  pairing it with other metrics, like bounce rate and pages per session can help determine quality traffic. However, this isn't as easy to measure as asking for a screenshot of social post insights. While you could rely on digging through your referral traffic, it'd be better to add query parameters to specifically track the clicks as part of an influencer campaign, because (hopefully) your influencer has already talked about you in the past so you want to differentiate that from the sponsored content. As I've found, even some bloggers that have been in the business for some time don't understand query parameters for tracking the links from their site, so it requires coaching here. Try not to dictate how they mention your brand for authenticity, so give them a few links, like your homepage, specific products, or categories with proper link tracking for your analytics tool.

Text link tracking is already established in an affiliate program. If you are able to work with well established industry content publishers through affiliate, like Buzzfeed or industry publications, you'll get much more traffic than a personal blog or social profile. The problem with going more towards an affiliate method to accomplish this is you won't likely get rights to their content for your use beyond sharing. Additionally, the downfall of clicks is that changes in the way cookies are collected, device switching, and omnichannel strategies mean you can easily lose track of a user after their initial visit, especially when the visit is initiated from a mobile app, like Instagram, and if your conversions typically happen on desktop. 

Remember to understand what goal you want to accomplish with each campaign and balance building those quality relationships Tara Hunt talked about with the massive reach of a popular content creator, because building a relationship with an influencer really does both for your brand.